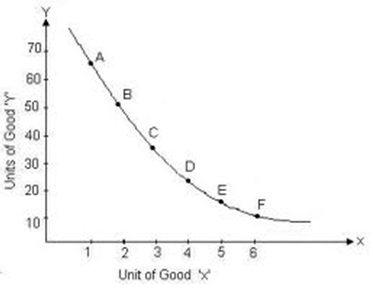
Indifference curve
A graph used to illustrate the effect of different quantitative combinations of goods on consumer satisfaction and behavior. A quantity of one good is shown on axis x and a quantity of another one – on axis y. The curve that is formed illustrates that certain consumers are equally satisfied at each curve’s point.
